Abstract
Benchmarking is an important step in the validation of an investment strategy because it compares the performance achieved to that of an investment alternative. In the case of private equity, this opportunity cost comparison typically assesses the performance of a fund or a portfolio of funds versus a public equity index.
The irregular nature of private equity cash flows makes benchmarking challenging; therefore, different methods have been developed by various academics and industry participants to address this matter. Capital Dynamics was an early contributor to this effort with the development of PME+, which overcomes the limitations of the traditional Public Market Equivalent comparison (PME, also known as Long-Nickels PME or as the Index Comparison Method). However, PME is very intuitive and is still widely used in the industry despite its downfalls.
Practitioners often perceive PME’s limitations as purely academic problems that are not applicable to funds in the real world. However, we have analyzed a large number of individual private equity funds and have proven that PME’s limitations affect the ‘real world’ analysis of funds. A large number of funds are affected by shorting problems and in many cases the public market equivalent performance cannot be computed. PME+, on the other hand, keeps the intuitive approach to benchmarking and ensures a rational comparison of private equity compared to public markets.
1. PRIVATE EQUITY PERFORMANCE MEASUREMENT
Measuring the performance of private equity is non-trivial due to the irregular timing of cash flows. The internal rate of return (IRR) and performance multiples are commonly used methods. Performance multiples compare the distributions to the investments. For example, the distributed-to-paid-in multiple (DPI) is the ratio between the investments and the distributions, whereas the total-value-to-paid-in ratio (TVPI) also takes the current net asset value (NAV) into account. Performance multiples have the drawback of disregarding the time value of money. The IRR takes the time value of money into account by computing the equivalent rate at which the present value of the investments is equal to the present value of the distributions and the NAV of the investment. Monitoring both, the IRR and multiples, results in a solid view of the performance of a private equity fund.
These performance measures are specific to the private equity asset class (or any asset class that has irregular cash flows) and allow the comparison between different funds. In the context of private benchmarking, peer fund comparisons are often used; they compare a fund’s performance to a selected peer group of funds and calculate the quartile in which the fund stands, e.g. a first quartile fund is in the top 25% of its peer group.
The performance assessment in the private equity universe is generally referred to as private benchmarking. Following the same logic, public benchmarking compares private equity funds and public benchmarks. It highlights any differences between private equity performance and public equity and, therefore, computes the opportunity cost of investing in private equity compared to public equity.
2. PUBLIC BENCHMARKING OF PRIVATE EQUITY
Public market returns are not directly comparable to private equity IRRs due to the timing of the investments. A natural way to achieve comparability is to mimic the private equity cash flows with a fictive public equity fund. This fund purchases and sells shares at the same time as the private equity vehicle calls and distributes cash. The NAV of the fictive fund, called the public NAV, depends on the number of shares and the share price (i.e. the index value). Table 1 illustrates how to derive the public NAV.
|
Year |
Capital calls |
Dist. |
NAV |
Public index |
Public shares owned |
Public NAV |
|
0 |
-1000 |
0 |
1000 |
100 |
10 |
1000 |
|
1 |
0 |
560 |
600 |
112 |
5 |
560 |
|
2 |
-60 |
0 |
700 |
120 |
5.5 |
660 |
|
3 |
0 |
280 |
370 |
140 |
3.5 |
490 |
|
4 |
0 |
240 |
300 |
120 |
1.5 |
180 |
Table 1. PME/ICM calculation illustration. (fictitious funds)
The fund presented above has an IRR of 11.7%. The public market equivalent performance can be computed by replacing the NAV with the public NAV; the calculated performance in this case is 7.9%, which represents an outperformance of 3.8%. It is important to note that the private and public vehicles have the same cash flows, but the final NAV (depending on the number of public shares) is different.
The number of shares being held by the public equity fund depends on the cash flows and on the benchmark returns. In some cases, this number can be negative, which leads to the shortness issue. This typically happens if the distributions are large or if the public index faces losses. The following table illustrates this situation.
|
Year |
Capital Calls |
Dist. |
NAV |
Public index |
Public shares owned |
Public NAV |
|
0 |
-1000 |
0 |
1000 |
100 |
10 |
1000 |
|
1 |
0 |
560 |
600 |
70 |
2 |
140 |
|
2 |
-60 |
0 |
700 |
75 |
2.8 |
210 |
|
3 |
0 |
280 |
370 |
70 |
-1.2 |
-84 |
|
4 |
0 |
240 |
300 |
75 |
-4.4 |
-330 |
Table 2. The fictive public equity fund can go short. (fictitious funds)
The public market equivalent performance (-23.9%) is computable, but its relevance is questionable as the number of shares owned is negative. For more complex cash flows, the fictive fund can go short and then recover, resulting in a positive end NAV. If the fictive vehicle holds short positions at any time, the validity of the PME calculation is not reliable.
In order to address this issue, Capital Dynamics introduced an alternative method to benchmark private equity called Capital Dynamics PME+ (PME+). PME+ scales the distributions by a factor λ such that the public NAV at the end is equivalent to the private NAV. The private equity fund and the fictive fund have the same capital calls and the same final NAV, but different distributionsTable 3. PME+ scales the distributions by a factor lambda such that the private and public NAV are equivalent at the end. (fictitious funds)
|
Year |
Capital Calls |
Dist. |
NAV |
Public index |
Lambda |
Public Dist. |
Public shares owned |
Public NAV |
|
0 |
-1000 |
0 |
1000 |
100 |
0.45 |
0 |
10.0 |
1000 |
|
1 |
0 |
560 |
600 |
70 |
|
251 |
6.4 |
449 |
|
2 |
-60 |
0 |
700 |
75 |
|
0 |
7.2 |
542 |
|
3 |
0 |
280 |
370 |
70 |
|
125 |
5.4 |
380 |
|
4 |
0 |
240 |
300 |
75 |
|
107 |
4.0 |
300 |
Table 3. PME+ scales the distributions by a factor lambda such that the private and public NAV are equivalent at the end. (fictitious funds)
PME accumulates the outperformance or underperformance in the final NAV, whereas PME+ spreads it over time across all distributions. Additionally, PME+ ensures that the number of public shares remains positive and, therefore, avoids the shortness issue.
PME and PME+ are relatively simple as well as intuitive and are both widely used in the private equity industry. Other benchmarking methods have been developed; however presenting them here is beyond the scope of this article and we would advise the reader to refer to Reyes & Long (2011)[1] or Reyes (2013)[2] for an overview of these methods.
[1] Reyes, J., & Long, A. (2011). Private Equity Benchmarks: Methods and Meaning. (Montana Capital Partners, Ed.) Private Equity International: Performance Measurement and Benchmarking in Private Equity, pp. 89-118.
[2]Reyes, J. (2013). PME - A History. http://www.j-curve.com/2013/11/04/pme-a-history/
3. QUANTIFYING THE SHORTNESS ISSUE
Although the problem of shortness is a well-known drawback of PME and has been noticed by many practitioners, its magnitude has never been quantified. To fill this gap, we have computed PME values for a sample of about 750 buyout and venture capital funds with vintage years that range from 1976 to 2008. About 60% of the funds cover North America, 35% Europe and 5% Asia.
Fund and public market equivalent performances have been computed using the four commonly used public indices: MSCI World, S&P 500, Russell 3000 and FTSE All Shares; each as a total return index. These indices are well-diversified, well-known and have sufficiently long histories to overlap all private equity funds in the sample.
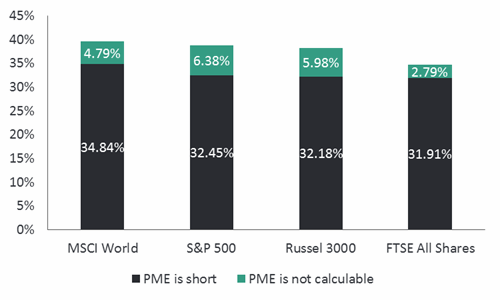
The severity of the shortness issue is generally underestimated. Of the considered sample, more than 30% of the funds have this problem, as shown in Figure 1. However, in many situations, this issue is not easily identified, as it does not generally prevent mathematically computing a PME figure. In more adverse situations, the IRR becomes incomputable; this generally happens when the final public NAV is a high negative number. In about 5% of the cases, PME is not calculable.
There are three potential outcomes when benchmarking a private equity fund: (1) outperformance indicates that the private equity fund is performing better than the public index, (2) underperformance indicates that the public index is performing better than the private equity fund, and (3) not calculable indicates that the benchmarking cannot be conducted for the reason described above. Table 4 displays the number of underperforming funds is approximately equal for PME and PME+, but the number of outperforming funds is not. This difference is caused by the number of “not calculable” funds for PME, which lies between 21 and 48 depending on the index. The failure rate can affect up to 6.4% of all funds, which means that every 16th fund cannot be calculated with PME. PME+, on the other hand, is able to benchmark every fund in the sample.
PME and PME+ have the ability to detect outperformance and underperformance. In the example from Table 4 when using the MSCI World index, PME and PME+ differ in only two cases. In both situations, the considered funds have a performance that is similar to the public market.
|
|
|
PME |
|
|
PME+ |
|
|
|
|
Benchmark index |
|
Out-performance |
Under-performance |
Not |
|
Out-performance |
Under-performance |
Not |
|
MSCI World |
|
366 |
350 |
36 |
|
400 |
352 |
0 |
|
S&P 500 |
|
303 |
401 |
48 |
|
352 |
400 |
0 |
|
Russell 3000 |
|
301 |
406 |
45 |
|
346 |
406 |
0 |
|
FTSE All Shares |
|
379 |
352 |
21 |
|
399 |
353 |
0 |
Table 4. Outcomes for PME and PME+ for different benchmarks.
Private equity funds that have performed very well have a PME that is not calculable. However, in many situations (about 25% of the funds), PME is calculable but has the shortness issue. The rest of this section illustrates the effect of the shortness issue within these funds.
The private equity outperformance can be quantified by subtracting the PME or PME+ value from the IRR of the fund. Thus, a difference of 0% means that the private equity fund has performed just as well as the public index. For this analysis, the MSCI World Total Return Index has been chosen because the private equity funds in the sample are spread across the world including a diversified set of industries. The dispersion of outperformances for PME and PME+ are depicted in Figure 2.
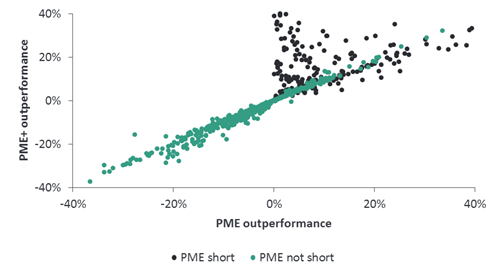
outperformance on the y-axis. The color of the dots indicates whether the PME
calculation is subject to the shortness issue or not.
Figure 2 shows that only outperforming funds have PME calculations that go short (marked as “short”), which is in line with what was stated previously. For the benchmarking results where PME calculations do not go short, PME and PME+ seem to exhibit a high correlation. A regression analysis reveals a correlation coefficient of 99%.
The funds marked as “short” exhibit an abnormal concentration close to 0% on the PME axis, which suggests that their outperformance of the public market is very low; although this is not always the case. PME+ shows that some of the “short” funds have a significant outperformance, although the outperformance measured by PME is indicated as very low. The fact that these funds have outperformed the public market is also corroborated by other benchmarking measures such as KS-PME.
In these cases, the PME outperformance is not observed for two main reasons:
- The number of public shares is negative and the index has a positive performance, which indicates a negative performance of the public portfolio
- A large negative cash flow due to the negative NAV might lead to multiple solutions for the IRR equation
Table 5 presents the outperformance within our dataset using PME and PME+. We observe a higher mean and median for PME+ as the PME shortness issue only affects very well-performing private equity funds.
|
Method |
Mean |
Median |
|
PME |
0.0% |
0.2% |
|
PME+ |
2.8% |
1.1% |
Table 5. Statistics of PME and PME+ outperformance.
The mean outperformance of private equity funds in our sample is 0% per annum with PME and 2.8% with PME+. According to these results, the PME benchmarking implies the sample performs just as well as the public market, while the PME+ benchmarking suggests the private equity sample outperforms the public market by almost three percent. Therefore, performance measurements using the PME method describe the performance of the private equity asset class as worse than it actually is because the PME benchmarking method cannot calculate some outperformances or gives doubtful results for well-performing funds.
Concluding remarks
PME and PME+ are both intuitive and good methods for benchmarking private equity funds with public market indices. However, the PME method has a mathematical issue that is evident amongst well-performing funds or in poor public market conditions. We have found that about 30% of private equity funds are affected by this shortcoming – in 5% of the cases, PME is not calculable. An adverse situation occurs when PME is calculable, but it is subject to the shortness issue. In this case, it is likely that the outperformance measured by PME is very low compared to the true outperformance; consequently, outstanding funds might look mediocre. Due to the reasons presented throughout this paper, we recommend using Capital Dynamics PME+ instead of PME when benchmarking private equity funds as it keeps the intuitive approach whilst delivering robust results.